


Flood Economics Introduction
Flood Economics
Helping communities and decision makers understand 30 years of flood mitigation data.
Flood Economics Introduction
Flood Economics
Helping communities and decision makers understand 30 years of flood mitigation data.
With FEMA keen to demonstrate how flood mitigation yields positive returns for local communities, they approached Ogilvy and the Economist Intelligence Unit to create a bespoke solution.
With the team at the EIU compressing 30 years of flood mitigation data I spearheaded the creative, visual and user experience direction of the platform; creating the visual tone and experience centred on the audience group that remained throughout the full design cycle of the project.
Promoting the social, environmental and economic benefits of taking action, I focused on delivering expert knowledge, recommending actions and designing an interactive data tool that showcased benefits. The platform has since been regarded as a success by multiple government agencies throughout the US and has included a personal 'thumbs-up' by President Obama.
Flood Economics Home
Flood Economics Home
Flood Economics Map
Flood Economics Map
Flood Economics Rating
Flood Economics Rating
Flood Economics Data
Flood Economics Data
Flood Economics Branding
Flood Economics Branding

brand
With Ogilvy promoting the platform via multiple social channels and supporting the launch with an awareness campaign, I created an identity that aligned itself with the platform.
word of mouth
The platform relies on 11 case studies that give an in-depth understanding to what challenges communities faced and how they dealt with them. 11 community case studies helped frame the research and give an understanding of the benefits of taking flood mitigation action on a local level.

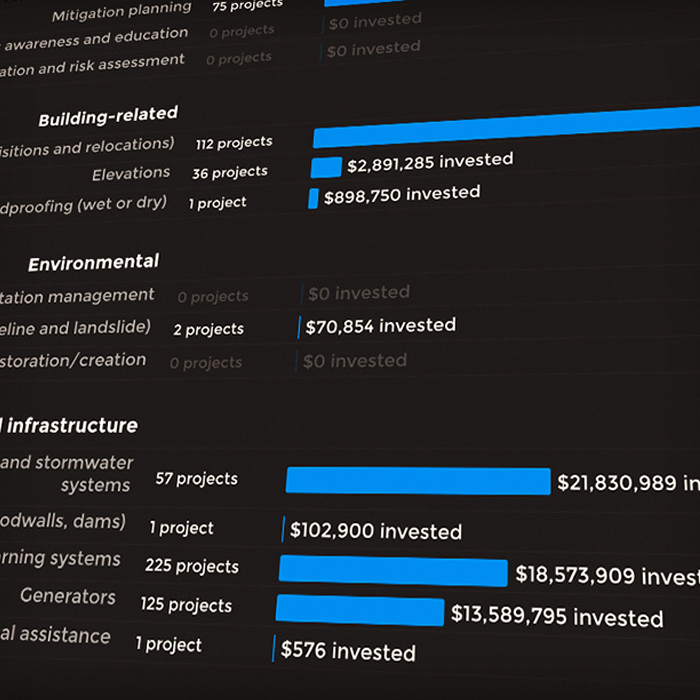
30 years of data
With the Economist Intelligence Unit analysing over 30 years of hard flood data from across the United States, we needed to ensure that the data display tool would reflect the density of such research, analysis and conclusion. Our solution was to devise a tool that revealed the cost per project and benefit cost ratio of each state within the US, allowing users to clearly grasp the benefits of investment.
Role: Creative direction, art direction and design
Client: FEMA, EIU & Ogilvy
Agency: Centric Mind
Shahin Nabavian - Head of Digital
Andress Tinoko - User Experience
Sally Goldman - Program Director
Richard Pullinger - Front End Developer